View and track your student survey submissions. Quickly see how many students have completed surveys, how many have started, and who might need extra prompting. Filter the report so you can focus on the information most important to you. Assign similar surveys annually and compare the reports year-over-year.
When you run a report on a survey your students have completed, there are three different views of the data available. You can view a visual summary of the results, a list of the questions in the survey with their results, and a view of all the data in one place in a table.
Read below to learn more about the views and a few tips and tricks for each.
Run a report
To run a report on the surveys students have filled out:
- From your educator account, under Reports, select Surveys.
 Click to enlarge
- This is the Surveys progress page. On the survey's progress report, view:
- The student groups assigned the survey
- The survey creator
- The survey due date
- The status (open or closed)
- The total number of submissions received
- The date a student last submitted the survey
 Click to enlarge
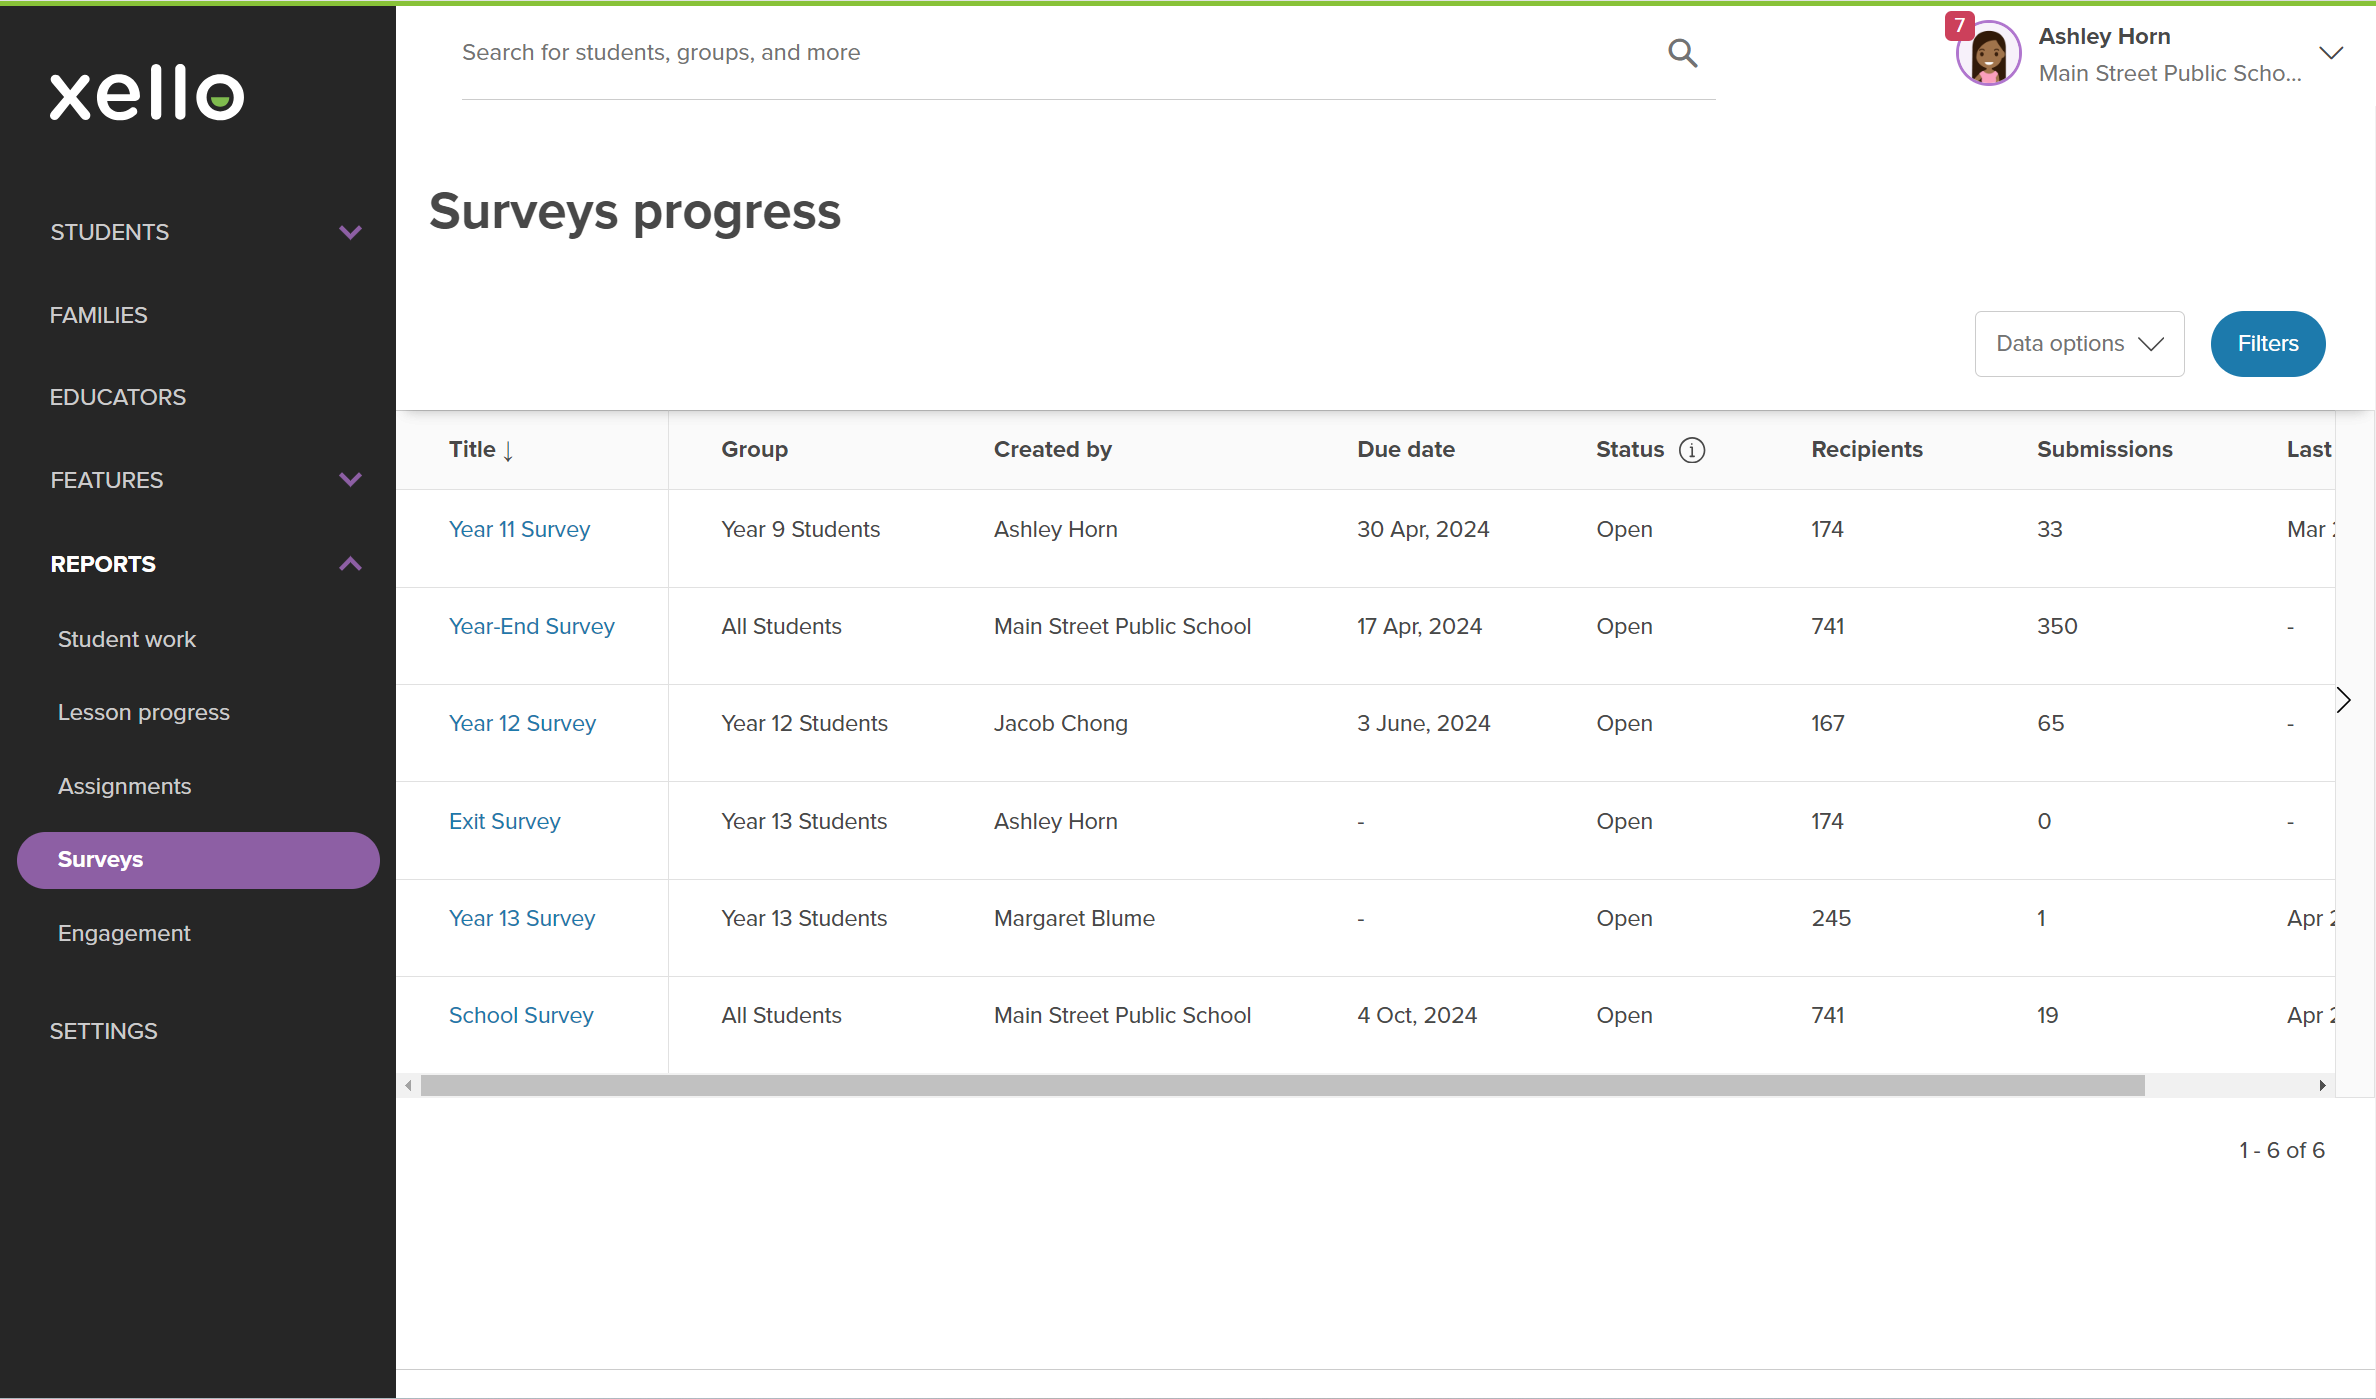
- Click on a survey title to dive deeper.
- By default, the first view will be the Summary view. You can change the view by clicking the dropdown at the top of the page. You have 3 report views to choose from:
- Summary view
- List view
- Full data view
 Click to enlarge
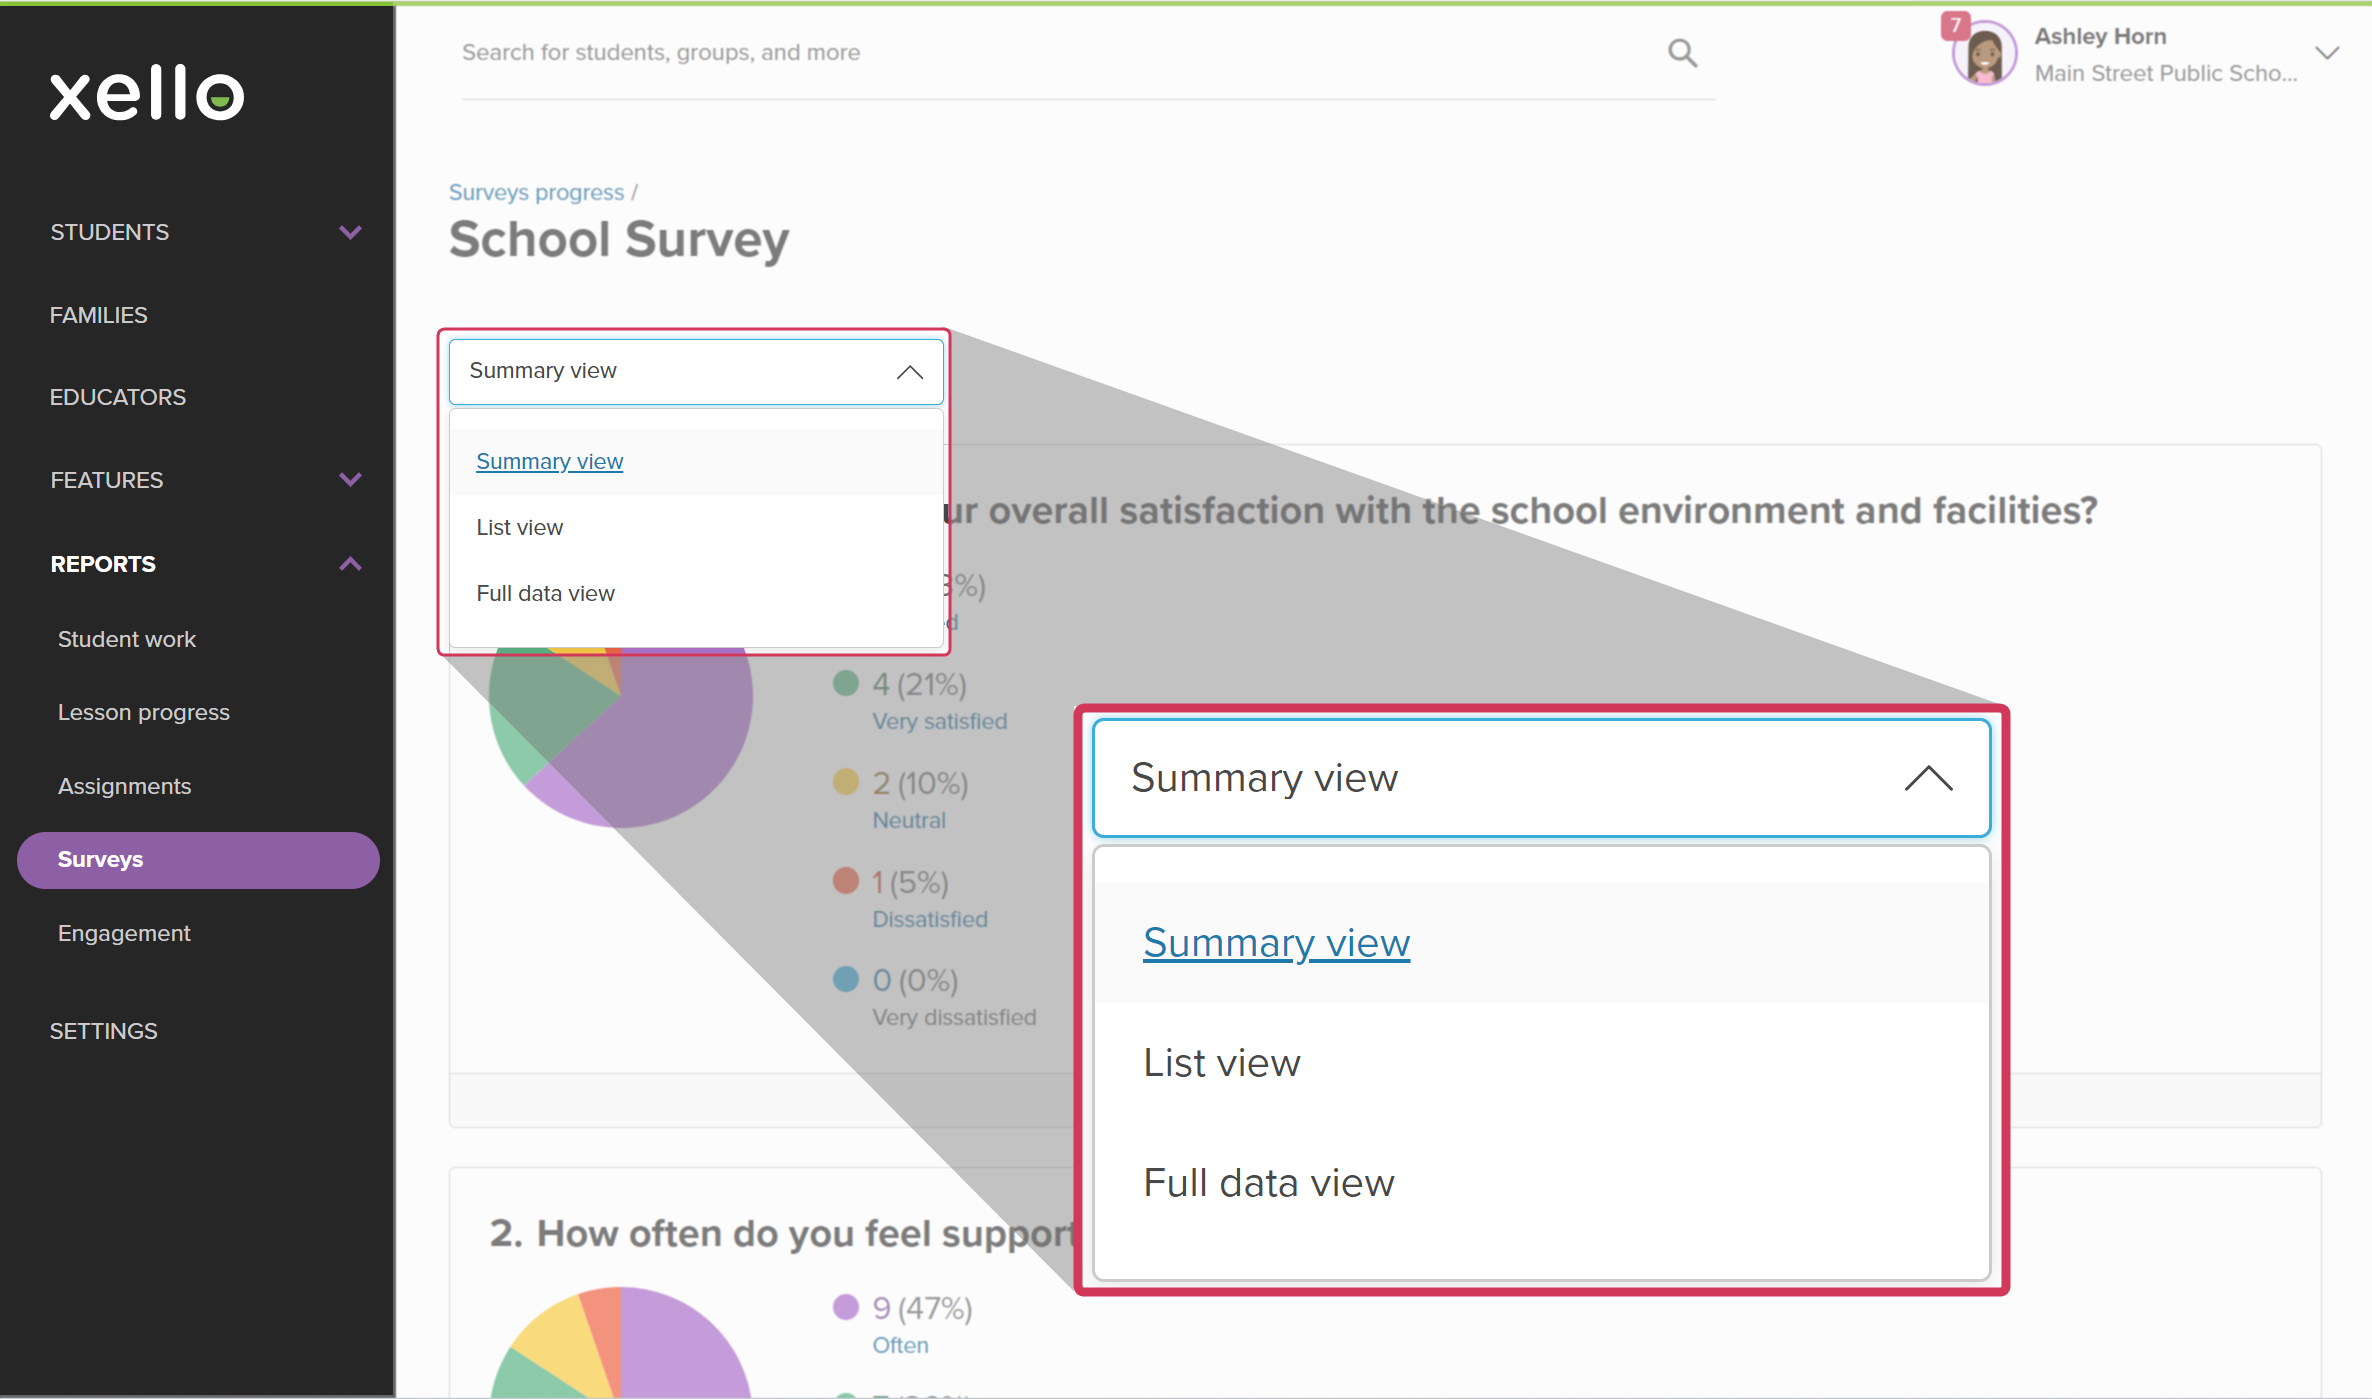
Summary view
The summary view provides data visualizations, in the form of either a pie graph or bar graph, representing the count and percentage of students who have selected each possible response to a close-ended question (e.g. multiple choice or dropdown). Click a response in the legend of the graph to see which students selected the response.

On this student data table, you can also add the students to a group, or send them all a message. This might be helpful if you’re looking for follow-up on their responses. You can click View all responses to see the breakdown of responses in tabular form.

From the list of available responses, click on one to see which students provided that answer.

From any student data table for a survey report, you can click on a student name to go to the student's profile. You'll land on the Survey tab where you can view the student's responses. If the student submitted more than once, you'll be able to view each submission.

List view
The list view lists all the questions in the survey - without the graphs - and a count of the responses each question has received. Click a question to see the number of students who selected the response.

From the list of available responses, you can click on one to see which students provided that answer.
On this student data table, you can also add the students to a group, or send them all a message. This might be helpful if you’re looking for follow-up on their responses.
From any student data table for a survey report, you can click on a student name to go to the student's profile. You'll land on the Survey tab where you can view the student's responses. If the student submitted more than once, you'll be able to view each submission.
Full data view
The full data view features all the survey data in a table, including student details, survey status, and any responses to the survey questions that they've submitted. From here you can export all data related to the survey. Clicking on a column title will rearrange the order for you. This way you can sort the table by student name, student ID,
For a deeper dive on a student's responses, you can click on their name to go to the student's profile. You'll land on the Survey tab where you can view each of their responses. If the student submitted more than once, you'll be able to view each submission.